Prof Trevor Hancock’s Healthy City Model (1993): A vanguard of Liveability[1]
In this article I discuss some of the impacts of the WHO Healthy Cities program, launched in 1986, in stimulating research to document and report on people’s relationships to place. I link this to contemporary research, led from Melbourne, Australia, which connects place, health, and liveability. I begin by revisiting a Sense of Community Index —also released in 1986 —which still provides a bridge for linking contemporary liveability research and urban policy to psychological conceptions of place.
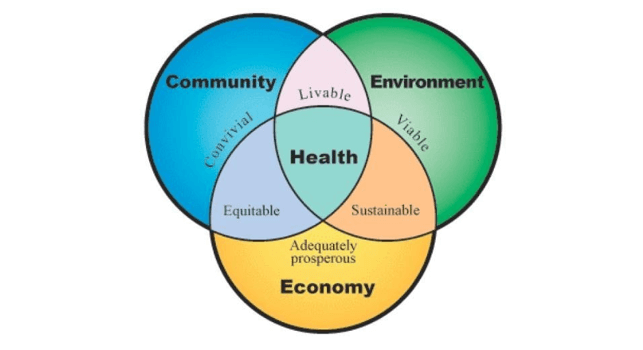
In 1993 Prof Trevor Hancock — co-founder of the WHO Healthy Cities program — offered an antidote to placelessness via his landmark Healthy Cities Model. This conceptual framework introduced the concept of liveability and showed how enhancing community wellbeing requires engaging sectors outside of ‘health’. These sectors include infrastructure planning, urban design and development, architecture, agriculture, employment and investment, education, art, culture, and environment[2]. Environments for health: promoting health and wellbeing through built, social, economic and natural environments, the Victorian municipal public health planning framework (2001) was anchored on this framework.
Core to ‘sense of place’ is Hancock’s notion of a community that is convivial, equitable, prosperous, viable, sustainable, and liveable:
The community itself needs to be convivial; that is to say, it needs to have social support networks, its members need to live harmoniously together and participate fully in the life of their community. In addition, the built environment of the community needs to be liveable, that is to say the urban structure should be designed in such a way as to support conviviality and to provide a viable human environment. Finally, the community needs to be equitable, that is to say its members are treated with fairness and justice, all their basic needs are met and they have an equal opportunity to achieve their maximum potential.[3]
The vision for ‘community’ embedded in Prof Hancock’s Healthy Cities Model was codified a few years earlier, in the Sense of Community Index.
Psychological sense of community
1986 was a watershed year. Not only did it see that launch of the WHO Healthy Cities program — which quickly became a global phenomenon[4] —but it also saw the proliferation of the Sense of Community Index.
Psychological sense of community is a core tenet of my discipline, Community Psychology. This discipline emerged in the late 1960s as a reaction to overly clinical, individualistic, deficit-focused analysis of the human condition. Related foundations include ecological systems thinking; the person-environment relationship; empowerment; social support; social justice; social justice; diversity. “Community psychology insists on multiple levels of analysis: individual (e.g., attitudes, cognitions, emotions), microsystem (e.g., family, classroom, team), organizational (e.g., a school, a church, an agency), community (e.g., geographic, identity, common experience communities), and macrosystem (e.g., ideologies, cultures, societal institutions)”[5]. This definition shows community psychology’s strong synergy with the social ecological approach that has informed Liveability indicator development, and even the notion of the 20-minute neighbourhood.
In their landmark 1986 paper, McMillan and Chavis defined sense of community as “a feeling that members have of belonging, a feeling that members matter to one another and to the group, and a shared faith that members’ needs will be met through their commitment to be together”[6]. Their early definition launched a huge body of research, dialogue and practice, including multiple efforts to refine the Sense of Community Index[7] [8] [9] [10] [11].
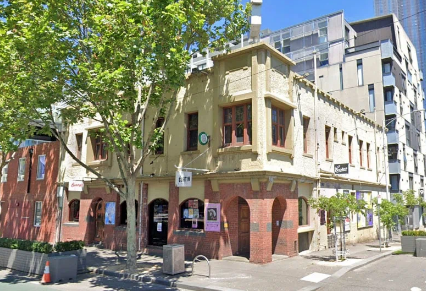
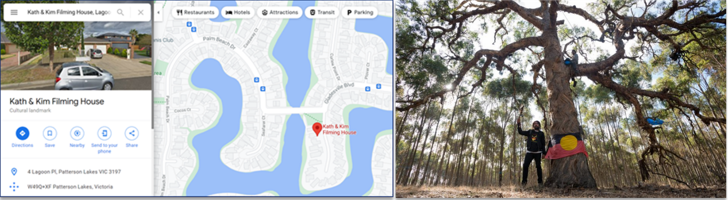
McMillan and Chavis defined sense of community in terms of four elements: (i) membership; (ii) influence, (iii) integration and fulfilment of needs and (iv) shared emotional connection. Membership is described as a feeling of belonging and relating to others. The authors note that especially in a neighbourhood setting, the notion of membership can derive from the symbolic boundaries that people use to denote their neighbourhood. It can relate to landmarks such as roads, railway lines or buildings, or other, more subtle markers, such as graffiti. Neighbourhoods can be proscribed by government ordinance, or be organic, resulting from patterns of interaction, folklore and identification built up over long periods. In terms of physical neighbourhood, the symbolism of locally treasured architectural landmarks, can provide a sense of collective identity as well as serve as a boundary from other districts. They provide people with a sense of belonging. The second component, influence, refers to “…a sense of mattering” (p. 9), in which a person feels as if their membership makes a difference to the group and that the group matters to them. The third element, integration and fulfilment of needs, refers to the reinforcement that derives from a person meeting their needs through membership to the group. The fourth component, shared emotional connection, refers to the sense of shared history, places, time, symbols, and experiences. People need not have participated in all the historic life of that neighbourhood to feel part of it, but they must identify with this history.
Building on McMillan and Chavis’ definition, Chavis et al’s Sense of Community Index, also from 1986[12] is shown below as an Attachment. It is presented as a guided interview format but could be delivered as a survey. Furthermore, the yes/no responses could be presented as Likert scales, ranging from “strongly agree’ to ‘strongly disagree’.
Since its release, this early PSOC Index has been critiqued and refined many times. However, it is worth having at least a passing familiarity with this early scale: firstly, because of its significance as a lodestar; secondly, because of its embrace of (at least some) early references to place identity, attachment, and dependence; and thirdly, because it can still be useful to the developers and policy makers who persist in referring to ‘sense of community’ without defining, measuring, or reporting on stated commitments to strengthen it. Furthermore, it might be argued that the 12 items that form the original Sense of Community Index could contribute to outcome measures of a convivial, thriving, intimate 20-minute neighbourhood — one which is full of street life, informal encounters with others, and which affords a subsequent sense of safety as per Jane Jacobs’ (1961) ‘eyes on the street’. Finally, even when used haltingly by local councils as part of community satisfaction surveys, some of these metrics could be used to triangulate some of the more distal measures of the built environment that form liveability indicators.
Developing indicators for healthy, liveable cities
With Indicators that Count! Measuring Population Health at the Community Level (1999), Hancock, Labonté and Edwards provided a participatory blueprint for using the Healthy Cities Model to develop community indicators that were policy-relevant, meaningful, feasible and replicable[13].
The population health work with which I’ve been involved for 20 years has tended to focus on the unobtrusive, incontestable features of the built environment that impact on health and wellbeing – often emphasising the concept of 20-minute neighbourhoods.
In a world dominated by transactional views of the human-environment relationship, public health advocates can use these quantitative measures to demonstrate the financial costs (to the health and human service system) of doing things badly, and the financial advantage (to governments and developers) by doing things well.
RMIT’s Healthy Liveable Cities Group has shown definitively that Liveability measures of the physical environment are critical to the capacity of Victorian planning and urban development sectors to deliver 20-minute neighbourhoods. These measures include things like housing diversity and affordability, local employment, walkability, food, access to green (and blue) space, social infrastructure, and public transport.[1]
Clearly, living in these great places would engender place dependency and satisfaction. But what does this mean psychologically? This is why I have been keen to share cognitions such as place attachment, place identity, place dependence (the corollary of satisfaction) and sense of community [Link to Blog Article 3], and to discuss how we must evolve our understanding of liveability.
Much of the Liveability research conducted to date provides clear points of connection to psychological conceptions of place. For example, Davern et. al.’s (2018) conceptual framework for social infrastructure shows many psychological phenomena related to people’s relationships with neighbourhood attributes. As shown below, these include community interactions, social cohesion, subjective wellbeing, perceived safety, and mental wellbeing[14].
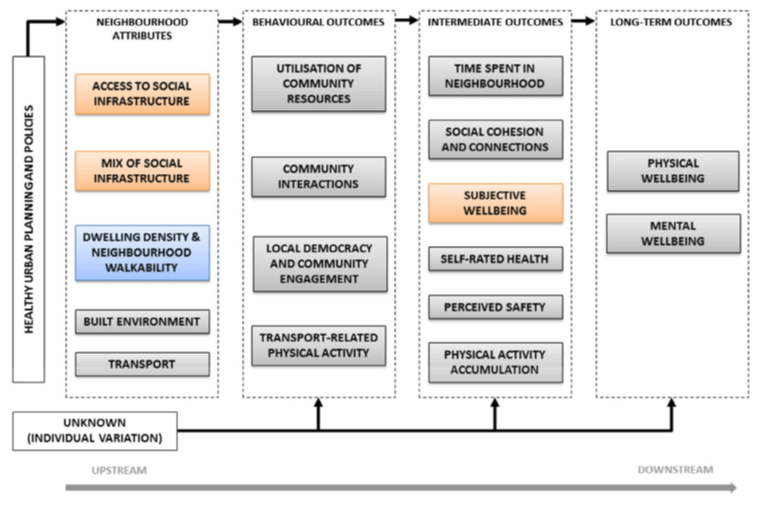
Figure 2 Davern et al’s (2018) conceptual model of social infrastructure, health and wellbeing specifying neighbourhood attributes, behavioural outcomes, intermediate outcomes, and long-term outcomes for health promoting urban planning and policy. [15].
Likewise, neighbourhood interactions, neighbourhood satisfaction, sense of safety, social cohesion and connections, social capital and mental wellbeing feature as ‘midstream’ and ‘downstream’ outcomes for the other six liveability policy domains. What we don’t currently have, however, is a repository of geospatial data that can correlate place attributes with psychological conceptions of place and longer-term health outcomes. For many, this may be a good thing – how can we possibly reduce complex cognitive, emotional, biographical and tribal phenomena into numbers that can be manipulated?
Prof Judith Innes and David Booher (1999)[16] noted that indicator projects often focus on developing the numbers instead of considering how they will be used. Producing the indicator report is often made a priority, as opposed to considering how the report may be used, or how the community can learn from the process of developing indicators in the first place. They argued that it is the joint learning that can occur among stakeholders, and the changes in practices that can occur, that is considered more important than the indicators themselves. However, what is learned and how practices may change depends on the way information is developed and who is involved. If it is collaborative and iterative, then the indicators can become part of the players’ meaning systems. “They act on the indicators because the ideas the indicators represent have become second nature to them and art of what they take for granted” (p. 7).
With Innes and Booher’s caveats in mind, I suggest that efforts to quantify some of the elements that comprise place attachment, identity and dependence could go some way to measuring outcomes of the 20-minute neighbourhood. Also, using quantities measures helps to engage policy mandarins within the dominant tribes in urban development, marketing, finance, Premier and Cabinet, Treasury, health, education and justice. Furthermore, exploring ways to engage these stakeholders in collaborative indicator development with affected communities may provide one avenue to codify these important human phenomena as core considerations and benchmarks for urban development policy and practice. It was this quest that led me to California nearly eighteen years ago.
Californian Healthy Cities and Communities program
For several months during 2003-2004, I attended the University of California at Berkeley as a Fulbright Visiting Scholar. At the time, I was a member of the then Victorian Department of Human Services’ Local Government Partnerships Team. Based within the Public Health Division, our team led the development and implementation of Environments for Health: Promoting Health and Wellbeing through Built, Social, Economic and Natural Environments. This municipal public health planning Framework actively encouraged enhanced integrated planning efforts amongst health, urban and corporate planners, and drew strongly on the WHO Healthy Cities approach.
At Berkeley’s School of Public Health, I was privileged to work with Leonard Duhl, Professor of Urban Planning and Public Health, and co-founder of the global WHO Healthy Cities initiative. My Fulbright research aimed to add value to municipal public health and wellbeing planning, Healthy Cities and other community building programs by examining the role that community cognitions (sense of place, sense of community, place identity, place attachment and place dependence) could play in community building, strategic planning, indicator development and public policy.
I was fortunate that my visit to Berkeley coincided with the release of Michelle Kegler, Barbara Norton and Robert Aronson’s Evaluation report of the five-year expansion program of Californian Healthy Cities and Communities (2003). Between 1998 and 2003, 20 diverse Californian cities and communities received three years’ funding to address locally identified issues and opportunities using a community-engaged approach that we would now recognize as collective impact. Most communities reported at least one change in public policy, of which three quarters were attributable directly to the Healthy Cities initiative. Interestingly, all participating communities reported at least one change in the physical environment because of their initiative. These included building or improving social infrastructure; building or improving parks and recreational facilities; improving public utilities, such as street repairs, street lighting, installing traffic lights and signs, and providing better access to fire hydrants; and neighbourhood and community beautification efforts. I was intrigued to explore how those cities may have tracked changes in people’s attachments to place and community.
Pasadena Quality of Life Index
Of the 20 Californian Healthy Cities that I investigated, one, the Pasadena/Altadena Healthy Cities Project, had developed a Quality-of-Life Index that included Architecture and Preservation in a broader measure of Arts and Culture: “The willingness of a community to maintain its architecture as a vibrant part of its life is an expression of the value placed on art, architecture, and history”.
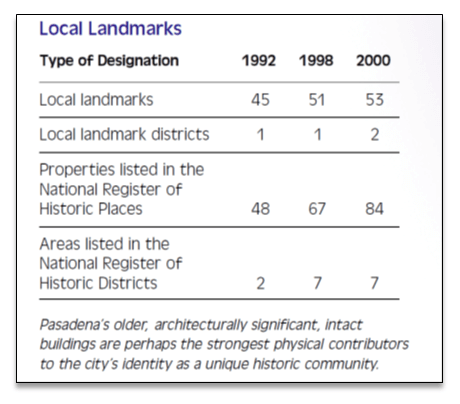
Geospatial measures of ‘Landmarks’ from the 2002 Pasadena/Altadena Quality of Life Index
The 2002 Pasadena/Altadena Quality of Life Index used unobtrusive measures such as the number of landmarked buildings and urban heritage sites as a proxy measure for the city’s identity, which was seen as related to people’s quality of life. The deeper issue here was around meaning of landmarks, which required different types of people to talk about their relationships with the same locations — even the same statues or buildings. (Of course, the process by which sites become ‘landmarks’ is itself a social process that reflects dominant power structures.)
These kinds of diverse and holistic measures of liveability are absent from Victorian Planning Provisions.
Plumas County Vision 2020
Another Californian Healthy Cities initiative was based in Plumas County, a rural county in the Sierra Nevada mountains in Northern California. On the invitation from the management team from ‘Plumas County Vision 2020’, I travelled to the town of Quincy to consult with the core organizing committee.
As a result of detailed community engagement and research, the Vision 2020 strategy included seven action areas. These included arts, culture, and heritage; business, economy and tourism; communication and technology; health and safety; land use; recreation; and youth. Of particular interest was this indicator for land use:
Participation by local residents in land-use decision-making increases perception that “quality of life” and “sense of belonging” by community members increases.
I was disarmed by this community’s sophisticated connection between participation in land use decisions and sense of belonging to place. As I recall, however, the Vision 2020 team were experiencing resistance from County administrators about adopting measures such as these into County reporting frameworks. In line with Innes and Booher’s warning[17], It appeared that County-level officials had not participated in the development of these indicators, and therefore were not willing for their policies or performance to be measured against them.
Opportunities for next steps
Our understanding of liveability — and the efficacy of the Victorian Planning Provisions — need to evolve to help us understand that our overall quality of life becomes more than just living in a convenient ‘20-minute neighbourhood’. It’s also about being able to live affordably in an ecologically sustainable place that is rich with meaning and provides a sense of identity and belonging, while also being somewhere we care about and are motivated to protect and enhance.
As Hernandez, Hidalgo and Ruiz have noted, this is a hugely diverse and complex field of enquiry[18]. Unsurprisingly, efforts to measure and document changes in ‘sense of place’ are equally complex.
Measures need to tap into elements of:
- person (both individual and group-levels),
- psychological process (emotion, cognition or identity, and behaviour or action), and
- dimensions of places themselves (including characteristics of place, and individual and group interplay between the social and physical features of a place).
Some measures are gathered using quantitative scales; others are gathered qualitatively. Ultimately, our understanding of ‘place’ requires us to engage with the people who live, work and play in places, and to work with community stakeholders to find policy responses that preserve peoples’ relationships whilst also allowing change to occur. Meanwhile, some general proxy measures of having achieved a ‘sense of place’ could include:
| ‘Place’ concept | Suggested measure |
| Place Identity | · Identifying with place, for example a Likert scale to map agreement with the statement, “I feel like I belong here”, or “this is where I consider home” [19].
· Identifying local landmarks with personal and /or community-level resonance · Geospatial data mapping of landmarks and heritage sites |
| Place Dependence | · Measures of place satisfaction, such as a Likert scale to test agreement with the statement, “there are things for people my age to do in my neighbourhood” [20], or
· Satisfaction with the extent to which where one lives performs as a 20-minute neighbourhood: “I am able to access the services and amenities that I need within a 20-minute trip from my home, by walking or using a bike or public transport” · Whether personal needs and obligations are met · Location and distribution of resources (liveability measures) · Stability (linked to but different from length of tenure) |
| Place Attachment | · A Likert scale to test agreement with the statement, “I don’t like or enjoy living where I do”[21].
· Feeling at home · Involvement in local activity · Focused involvement in place · Existence of social relations to neighbourhood |
| Critical social awareness of place | · Measures of psychological sense of community — drawing on Chavis et al’s 1986 scale (see Attachment) and more recent scales
· Understanding political and policy environment and having a sense that one can act to change it. · Greater knowledge of locale (including Indigenous history) |
We need to track changes in more than just the physical environment, but also people’s relationships with it. To achieve this, we must engage citizens and policy makers.
Some of the questions that remain for me:
- Can our liveability analyses, community discussions and urban planning policies and strategies consider documenting changes to the concentration and location of historic sites, landmarks, and heritage buildings?
- What is the concentration, location and accessibility of signage that indicates First Nations significant locations, including sacred places and massacre sites?
- How many statues or sculptures represent the narratives of all peoples who live and/or have lived in a place (i.e., not only white colonial men?)
Attachment: Sense of Community Index — Chavis et al (1986)[22]
Interviewer script: I am going to read some statements that people might make about their neighbourhood. Each time I read one of these statements, please tell me if it is mostly true or mostly false about your neighbourhood simply by saying ‘true’ or ‘false’.
- I think my area is a good place to live
- People in this area do not share the same values
- My neighbours and I want the same things from our neighbourhood
- I can recognise most of the people who live near my place
- I feel at home in my neighbourhood
- Very few of my neighbours know me
- I care about what my neighbours think of my actions
- I have no influence over what my neighbourhood is like
- If there is a problem in this neighbourhood then people who live nearby can solve it
- It is very important to me to live in this neighbourhood
- People in this area generally do not get along with each other
- I expect to live in this area/neighbourhood for a very long time
Original Scale
True =1; False = 0. Scores for original items 2, 6, 8, and 11 need to be reversed before scoring. Total Sense of Community Index =total Items 1 through to 12.
Subscales:
- Membership = Items 4+5+6
- Influence = Items 7+8+9
- Reinforcement of needs = Items 1+2+3
- Shared emotional connection = Items 10+11+12
References
[1] It’s worth noting that even with access to RMIT’s world-leading Australian Urban Observatory, the Liveability domains for the Victorian Public Health and Wellbeing Outcomes Framework, launched in 2016, remain incomplete.
[1] Hancock, T. (1993)., Health, human development and the community ecosystem: Three ecological models. Health Promotion International 8(1) DOI: 10.1093/heapro/8.1.41, pp. 41-47.
[2] Wilkinson, R. and Marmot, M. (eds) 2003, Social Determinants of Health: The Solid Facts, 2nd edn, Copenhagen: World Health Organization. http://www.who.dk/document/e81384.pdf
[3] Hancock, T. (1993)., Health, human development and the community ecosystem: Three ecological models. Health Promotion International 8(1) DOI: 10.1093/heapro/8.1.41, pp. 41-47. Cited p. 44.
[4] Hancock, T. (2017). Healthy Cities emerge: Toronto–Ottawa–Copenhagen. Healthy Cities. New York, NY: Springer New York, pp. 63–73.
[5] https://www.britannica.com/science/community-psychology
[6] McMillan, D, & Chavis, D. (1986) Sense of community: A definition and theory. Journal of Community Psychology 14.1, 6–23.
[7] McMillan, D. & Chavis, D. 91986). “Sense of community: A definition and theory. Journal of community psychology 14.1pp. 6–23.
[8] Chavis, David M et al. “Sense of community through Brunswik’s Lens: A first look.” Journal of community psychology 14.1 (1986): 24–40.
[9] https://www.senseofcommunity.com/soc-index/
[10] Halamová, J., Kanovský, M., & Naništová, E. (2018). Development and psychometric analysis of the sense of community descriptors scale. Psychosocial Intervention, 27, pp. 44-55. Available: https://doi.org/10.5093/pi2018a8
[11] Jason, L. A., Stevens, E., & Ram, D. (2015). Development of a Three-Factor Psychological Sense of Community Scale. Journal of community psychology, 43(8), 973–985. https://doi.org/10.1002/jcop.21726
[12] Chavis, D. M., Hogge, J. H., McMillan, D. W., & Wandersman, A. (1986). Sense of community through Brunswick’s lens: A first look. Journal of Community Psychology, 14, 24-40.
[13] Hancock, T, Labonte, R., & Edwards, R. (1999). Indicators that count! Measuring population health at the community level. Canadian journal of public health 90 S1: S22–S26.
[14] Davern, M., Gunn, L., Whitzman, C., Higgs, C., Giles-Corti, B., Simons, K., Villanueva, K., Mavoa, S., Roberts, R., & Badland. H. (2018): Using spatial measures to test a conceptual model of social infrastructure that supports health and wellbeing, Cities & Health, DOI: 10.1080/23748834.2018.1443620
[15] Davern, M., Gunn, L., Whitzman, C., Higgs, C., Giles-Corti, B., Simons, K., Villanueva, K., Mavoa, S., Roberts, R., & Badland. H. (2018): Using spatial measures to test a conceptual model of social infrastructure that supports health and wellbeing, Cities & Health, DOI: 10.1080/23748834.2018.1443620
[16] Innes J., & Booher, D. E. (1999). Indicators for sustainable communities : A strategy building on complexity theory and distributed intelligence. Berkeley, CA: Institute of Urban and Regional Development, University of California at Berkeley.
[17] Innes J., & Booher, D. E. (1999). Indicators for sustainable communities : A strategy building on complexity theory and distributed intelligence. Berkeley, CA: Institute of Urban and Regional Development, University of California at Berkeley.
[18] Hernandez, B., Hidalgo, M.C., & Ruiz, C. (2021). Theoretical and methodological aspects of research on place attachment , in L. Manzo & P. Devine-Wright, Place attachment: Advances in theory, methods and applications (2nd ed.), pp. 95-110. London: Routledge.
[19] Pretty, G. (2002). Young people’s development of the community-minded self. In A. T. Fisher, C. C. Sonn, & B. J. Bishop (Eds.), Psychological sense of community: Research, applications, and implications (pp. 183-203). New York: Kluwer Academic/Plenum Publishers. Quoted p. 192.
[20] Pretty, G. (2002). Young people’s development of the community-minded self. In A. T. Fisher, C. C. Sonn, & B. J. Bishop (Eds.), Psychological sense of community: Research, applications, and implications (pp. 183-203). New York: Kluwer Academic/Plenum Publishers. Quoted p. 192.
[21] Pretty, G. (2002). Young people’s development of the community-minded self. In A. T. Fisher, C. C. Sonn, & B. J. Bishop (Eds.), Psychological sense of community: Research, applications, and implications (pp. 183-203). New York: Kluwer Academic/Plenum Publishers. Quoted p. 192.
[22] Chavis, D. M., Hogge, J. H., McMillan, D. W., & Wandersman, A. (1986). Sense of community through Brunswick’s lens: A first look. Journal of Community Psychology, 14, 24-40.